ECONOMIC CHART PACK
Beginning in June 2020, Saul began publishing the Coronavirus Impact Chart Pack, a weekly publication tracking the course of Covid-19 and its impact on economies around the world, including Australia and New Zealand. Starting at just under 60 pages, by the second half of 2021 it had grown to more than 150 pages.
From the beginning of this year, 2022, the Chart Pack has been replaced with three separate publications:
- The World Economy this Week, published on Monday mornings (Australian time); and
- The Australian Economy this Week, published on Friday afternoons (Australian time).
Each of these chart packs will continue to trace the impact of the virus (for as long as that’s relevant), economic data, developments in monetary and fiscal policy, trends in financial markets, and (where relevant) political developments. They will be accessible to subscribers of the Premium Access package.
The World Economy chart pack will have sections covering the global economy, and the economies of major regions – including the United States, Europe, China, Japan, other East Asian countries, India, Canada, Australia and New Zealand (very briefly), Latin America and Central & Eastern Europe.
"I see a lot of chart packs in my line of work, but yours is about the best I have seen. It is amazingly comprehensive, covering far more of the world than any individual is entitled to cover, the charts are clear and easy to understand and they drill down into each topic in a very satisfying way. So well done, Saul."
Alan Kohler, ABC finance presenter, founder of Eureka Report
"A timely and comprehensive summary from one of Australia's best economists."
Adam Creighton, Economics Editor for The Australian
“I continue to find your thinking invaluable - this year to my ritual weekend reading of the economist I have happily added ‘Saul’s latest’.”
Rufus Black, former Managing Partner of McKinsey’s, and currently Vice-Chancellor of the University of Tasmania
“Your chart pack is amazing - and thanks for offering to add me to the mailing list, that would be great to be included. Everything you could want to know is there - and the way the data are organised and presented to tell the stories makes it so easy to follow.”
Prof Jeff Borland, Truby Williams Professor of Economics, The University of Melbourne, Website
“An excellent summary. Although I take a great interest in what’s happening with COVID-19 day by day In Australia and Internationally, I always find your weekly summary a very interesting review of the past week.”
retired former Chief Executive Officer of a District Hospital Service in New South Wales
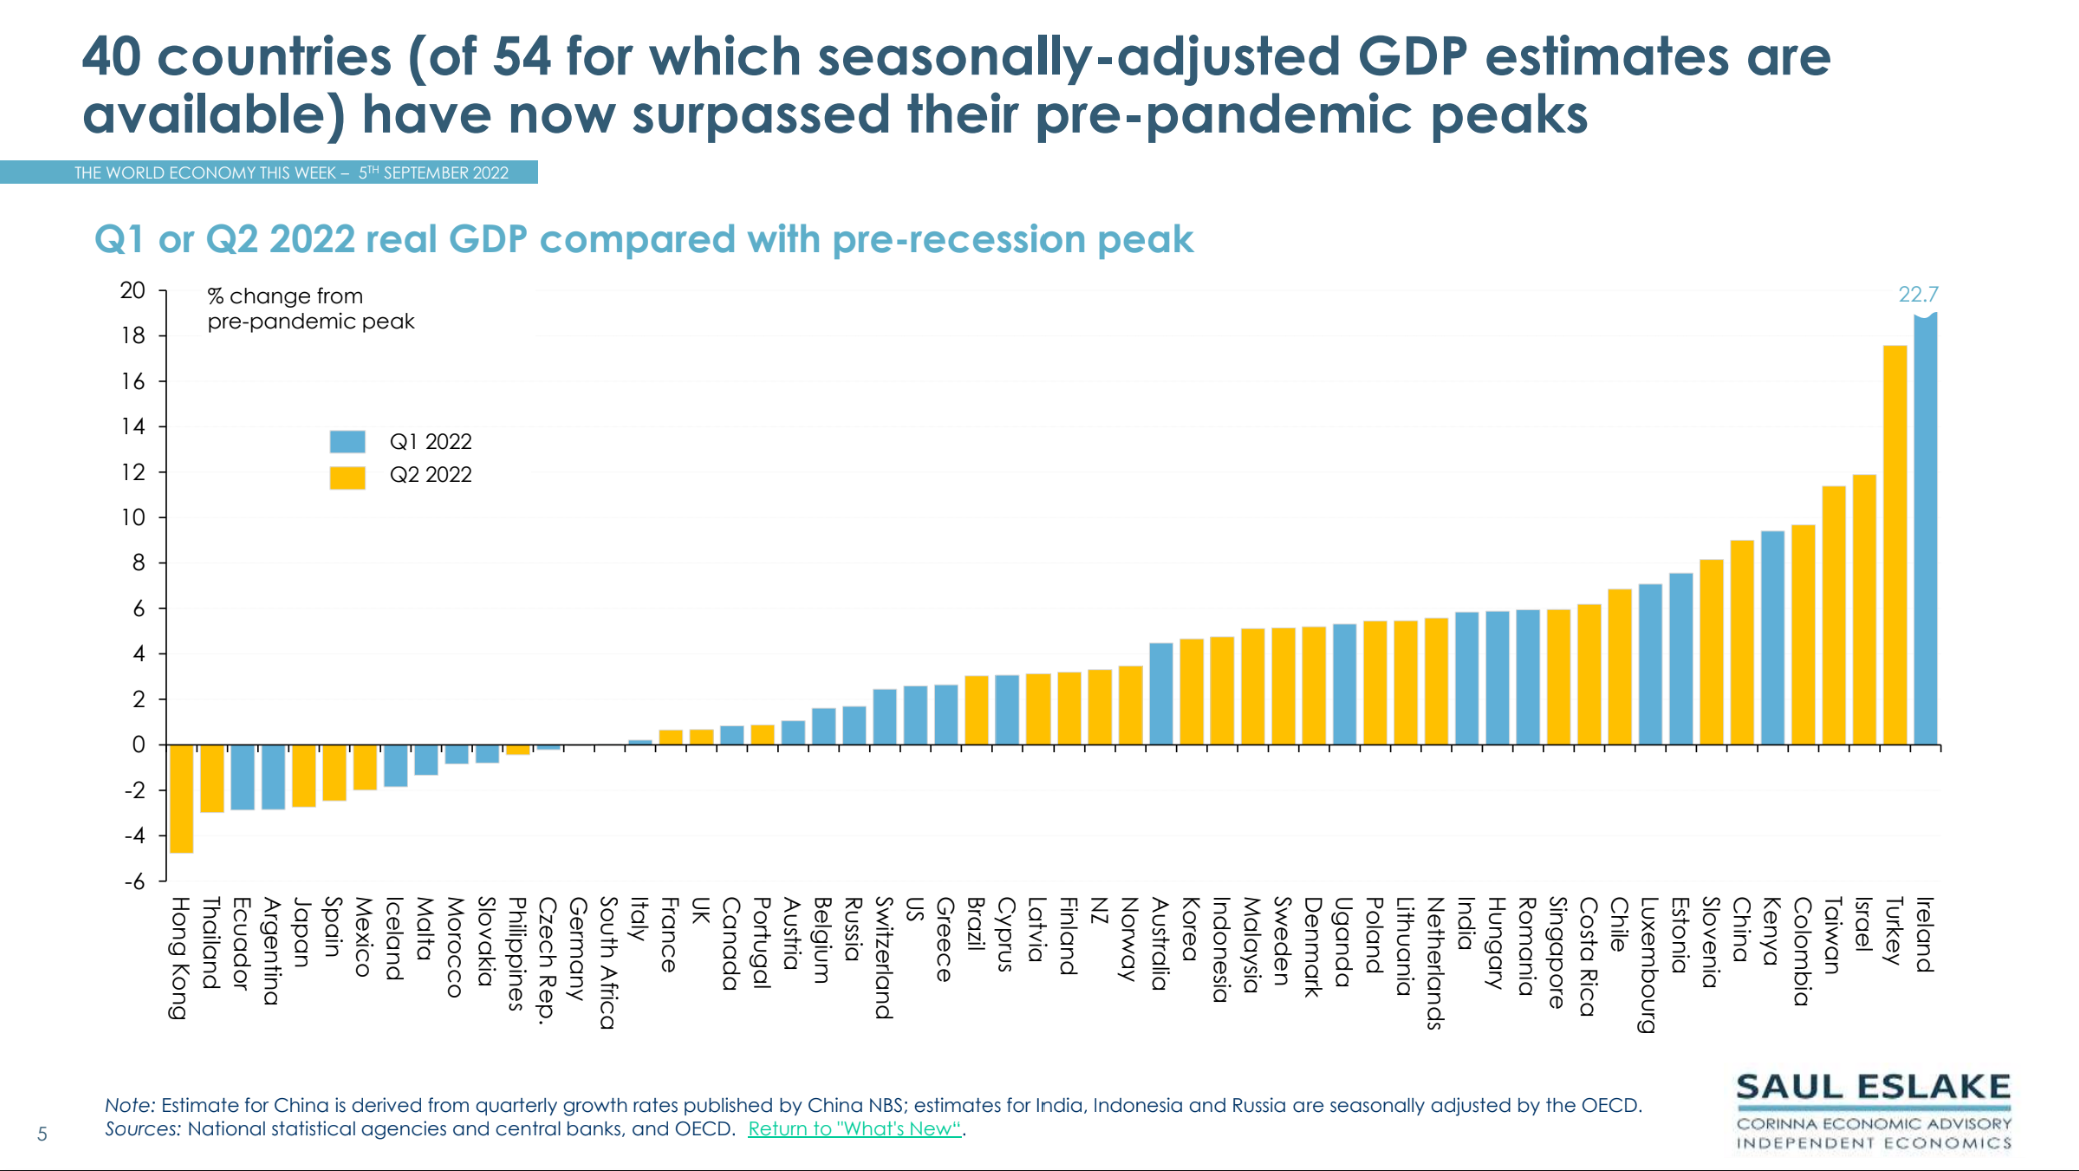
THE WORLD ECONOMY THIS WEEK
5th September 2022
This chart pack, published on Monday morning (Eastern Australian time) each week, portrays developments in the global economy and in the economies of major nations and regions – the United States, Europe, China, Japan, other East Asian economies, India, Canada, Australia & New Zealand*, Latin America and Central & Eastern Europe – with particular emphasis on:
- the impact of Covid-19,
- broad indicators of economic growth,
- conditions in the business sector
- the household sector, and consumer spending
- housing finance and construction. and the residential property market
- the labour market
- commodity prices, trade and the balance of payments
- inflation,
- fiscal and monetary policy,
- Australian financial markets
The pack typically runs to 110-120 pages and includes more than 570 individual charts as well as tables and text.
* for more detailed coverage of Australia and New Zealand please see The Australian Economy this Week and The New Zealand Economy this Month, respectively.
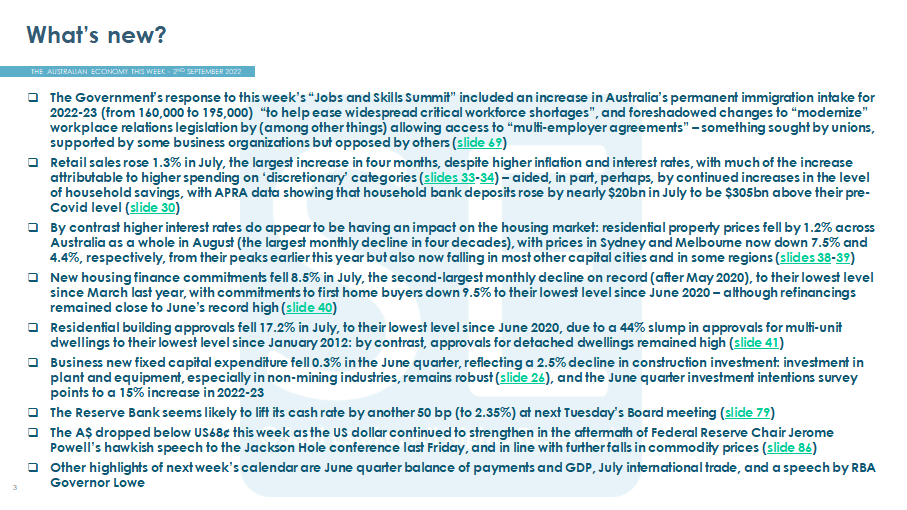
THE AUSTRALIAN ECONOMY THIS WEEK
2nd September 2022
This chart pack, published on Friday evening (Eastern Australian time) each week, portrays developments in the Australian economy, with particular emphasis on:
- the impact of Covid-19,
- broad indicators of economic growth,
- conditions in the business sector
- the household sector, and consumer spending
- housing finance and construction. and the residential property market
- the labour market
- commodity prices, trade and the balance of payments
- inflation,
- fiscal and monetary policy,
- Australian financial markets
Closer to this year’s federal elections – which have to be held no later than 29th May – we will include some pages on political developments as well.
The pack typically runs to 80-90 pages and includes some 280 charts.
For coverage of the global economy, please see The World Economy this Week
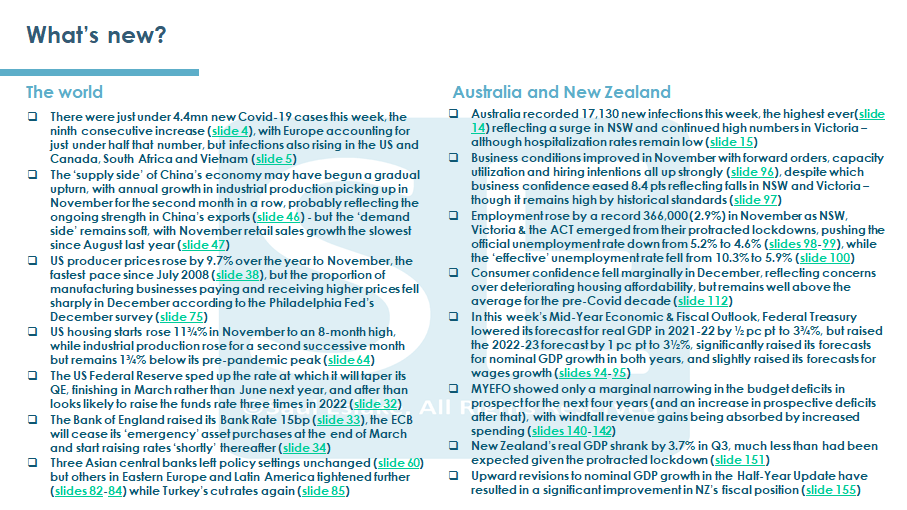
CORONAVIRUS IMPACT CHART PACK
June 2020 - December 2021Each weekend since mid-April I’ve been preparing, updating and distributing a weekly Coronavirus Impact Chart Pack to people in Australia and overseas. Running to over 100 pages it includes:
- charts tracking the spread of Covid-19, globally and in Australia, and government responses to it;
- the impact on the global economy and major individual economies such as China, Japan, other Asian economies, the US and Europe;
- financial and commodities markets;
- multiple aspects of the Australian economy, including state-level comparisons, and the policy responses of the Australian and state or territory governments, and the Reserve Bank of Australia; and
- similar, though smaller coverage of the New Zealand economy.
The Coronavirus Impact Chart Pack will be updated every Saturday afternoon, Australian time, for as long as it remains topical. It will be accessible to subscribers of the Premium Access package.
If and when Covid-19 ceases to be front and centre of attention (as it is now) – whenever that might be – I will continue to prepare a Weekly Chart Pack, but with a focus on whatever replaces the virus as the issue du jour.


